top of page
Home
About US
Services
Renewable Power Solutions
Conventional Power Solutions
Hybrid Power Solutions
Energy Storage Systems
Opportunities
Careers
Franchise
Partner with us
Research Oppurtunities
Support
Forum
Members
More
Use tab to navigate through the menu items.
Log In
COMBINED CYCLE PLANTS
Play Video
Play Video
10:28
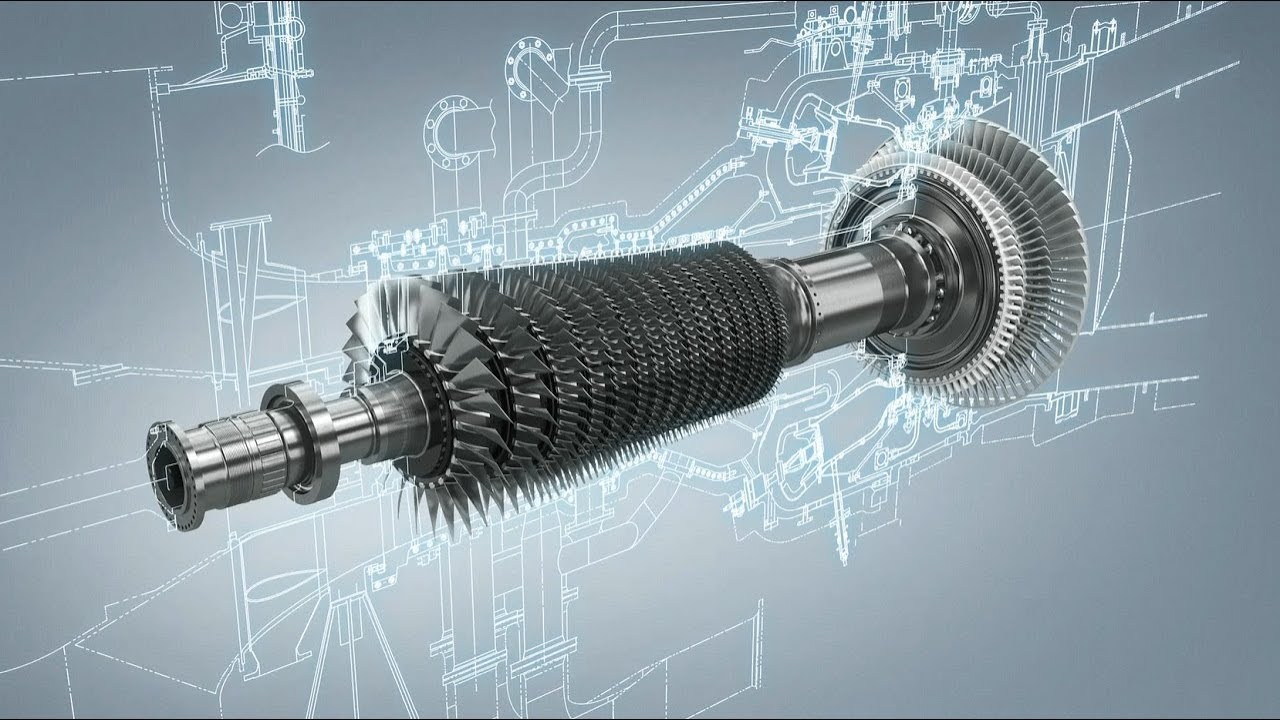
The Siemens SGT-800 A 50-MW-class industrial gas turbine
The Siemens SGT-800 is a 57 MW industrial gas turbine. It combines a robust, reliable design with high efficiency and low emissions. The turbine is an ideal choice for municipal and industrial power generation, refineries, and the oil and gas industry. The SGT-800 achieves lowest lifecycle costs and the best combined-cycle efficiency within its class. https://www.siemens.com/global/en/home/
Play Video
Play Video
03:01
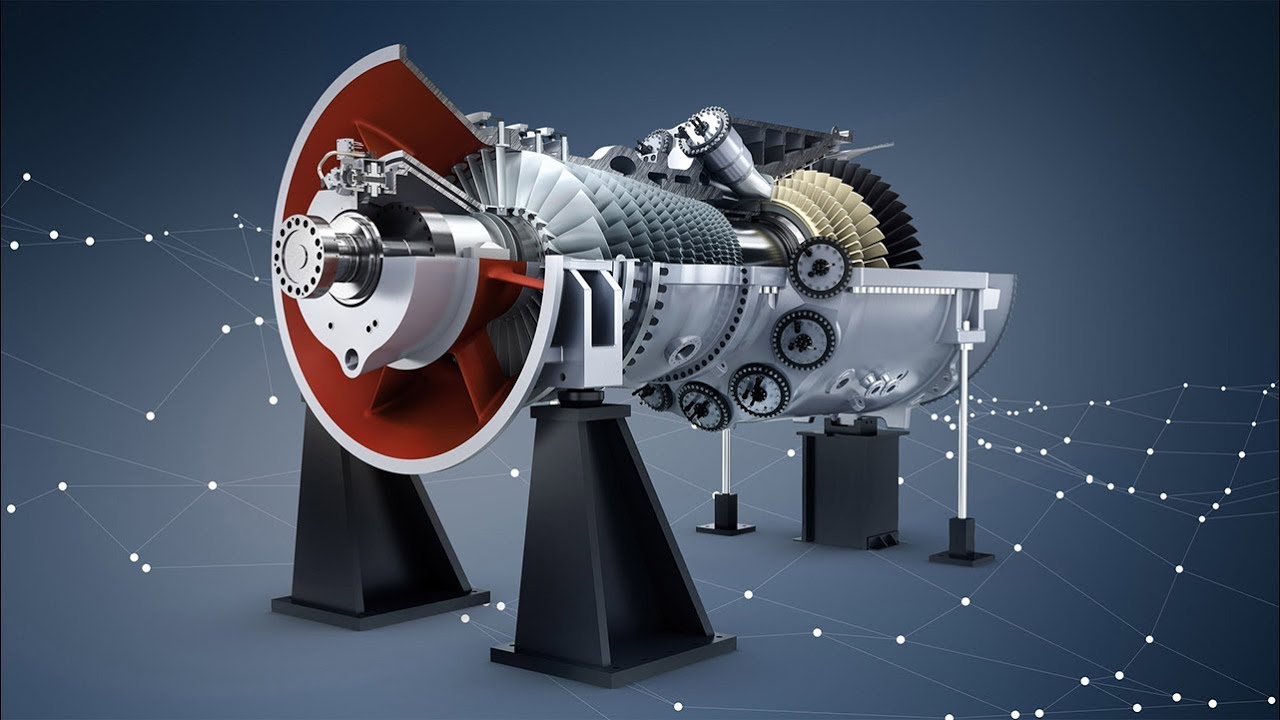
Siemens HL-class gas turbines for higher power plant efficiency
The advanced Siemens HL-class gas turbines combine a series of new but already tested technologies and design features with the best of past experience clearing the way to efficiency levels beyond 63 percent with a mid-term goal to reach 65 percent. The series consists of three engines: SGT5-9000HL, SGT6-9000HL and SGT5-8000HL.
Play Video
Play Video
FlexEfficiency 60 Combined Cycle Power Plant | GE Power
When the products from GE's FlexEfficiency 60 Portfolio are brought together to form a combined cycle power plant, the benefits—and opportunities—are tremendous. An innovative example of an adaptable integrated plant, the FlexEfficiency 60 Combined Cycle Power Plant features a multi-shaft configuration that will generate a new level of baseload efficiency—greater than 61 percent—while also retaining high efficiency at part load.1 Given the variability of fuel prices and changing emissions requirements, the FlexEfficiency 60 Plant is a certain asset in uncertain times. #GEPower #PoweringForward Subscribe for More: https://bit.ly/2N82PfY Work for GE: https://invent.ge/2F0yg76 GE Power Social Accounts: Visit GE Power: https://invent.ge/2Blgkr1 Find GE Power on Linkedin: https://bit.ly/2L34UaT Follow GE Power on Twitter: https://bit.ly/2MVIVoh Like GE Power on Facebook: https://bit.ly/2OMQcaz Follow GE Power on Instagram: https://bit.ly/2MuWG0c About GE Power: GE Power is a world energy leader providing equipment, solutions and services across the energy value chain from generation to consumption. Operating in more than 180 countries, our technology produces a third of the world’s electricity, equips 90 percent of power transmission utilities worldwide, and our software manages more than forty percent of the world’s energy. For more information please visit www.ge.com/power, and follow GE Power on Twitter and on LinkedIn. https://www.youtube.com/c/GEPower
Play Video
Play Video
08:21
Siemens SGT-750 gas turbine flythrough
http://www.siemens.com/energy/sgt-750 A novel perspective on an innovative turbine
Play Video
Play Video
03:28
Siemens’ Flex-Plants™ - Flexible Combined Cycle Power Generation
When we switch on the lights, most of us aren’t thinking about how electricity is generated. What really happens, how does a power plant work? Siemens’ proven Flex-Plant™ Combined Cycle Technology provides clean, efficient, and reliable electricity when it’s needed most. (http://www.siemens.com/energy)
SOLAR SOLUTIONS
Play Video
Play Video
14:29
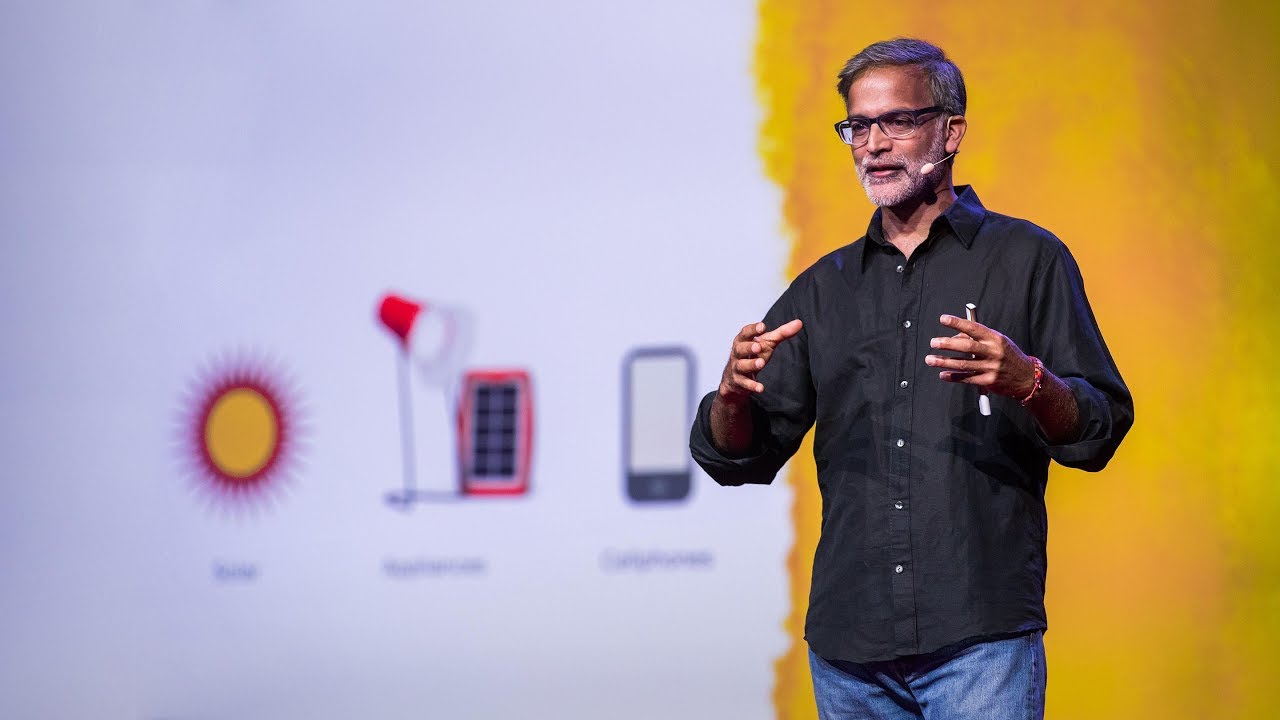
The Thrilling Potential for Off-Grid Solar Energy | Amar Inamdar | TED
There's an energy revolution happening in villages and towns across Africa -- off-grid solar energy is becoming a viable alternative to traditional electricity systems. In a bold talk about a true leapfrog moment, Amar Inamdar introduces us to proud owners of off-grid solar kits -- and explains how this technology has the opportunity to meet two extraordinary goals: energy access for all and a low-carbon future. "Every household a proud producer as well as consumer of energy," Inamdar says. "That's the democracy of energy." (Followed by a brief Q&A with TED Curator Chris Anderson) Check out more TED Talks: http://www.ted.com The TED Talks channel features the best talks and performances from the TED Conference, where the world's leading thinkers and doers give the talk of their lives in 18 minutes (or less). Look for talks on Technology, Entertainment and Design -- plus science, business, global issues, the arts and more. Follow TED on Twitter: http://www.twitter.com/TEDTalks Like TED on Facebook: https://www.facebook.com/TED Subscribe to our channel: https://www.youtube.com/TED
Play Video
Play Video
03:58
The 'duck curve' is solar energy's greatest challenge
Renewables require change in the energy supply chain. Subscribe to our channel! http://goo.gl/0bsAjO Electricity is incredibly difficult to store, so grid operators have to generate it at the exact moment it is demanded. In order to do this, they create incredibly accurate models of the total electric loads, that is how much energy will be consumed on a given day. But as utilities started to produce more energy from renewable sources like solar, the models started to shift as well. California researchers discovered a peculiarity in their state’s electric load curves, that started to look more and more like a duck. And that duck shaped chart highlights the greatest challenge to solar energy growth in the US. Vox writer David Roberts has been covering the issue for a few years now. You can read some of his past explainers on the duck curve, and its solutions at the links below: https://www.vox.com/energy-and-environment/2018/3/20/17128478/solar-duck-curve-nrel-researcher https://www.vox.com/2016/2/10/10960848/solar-energy-duck-curve https://www.vox.com/2016/4/8/11376196/california-grid-expansion https://www.vox.com/2016/2/12/10970858/flattening-duck-curve-renewable-energy And if you would like to read some of the source material used in the video above, you can check those out here: https://www.caiso.com/documents/flexibleresourceshelprenewables_fastfacts.pdf https://www.nrel.gov/docs/fy16osti/65023.pdf Vox.com is a news website that helps you cut through the noise and understand what's really driving the events in the headlines. Check out http://www.vox.com. Watch our full video catalog: http://goo.gl/IZONyE Follow Vox on Facebook: http://goo.gl/U2g06o Or Twitter: http://goo.gl/XFrZ5H
Play Video
Play Video
04:43
Why aren't we only using solar power? - Alexandros George Charalambides
View full lesson: http://ed.ted.com/lessons/why-aren-t-we-only-using-solar-power-alexandros-george-charalambides Solar power is cheaper and more sustainable than our current coal-fueled power plants, so why haven't we made the switch? The real culprits here are the clouds, which make solar power difficult to control. Alexandros George Charalambides explains how solar towers and panels create electricity and how scientists are trying to create a system that can function even under cloud cover. Lesson by Alexandros George Charalambides, animation by Ace & Son Moving Picture Co., LLC.
Play Video
Play Video
02:48
Solar Thermal 101
Solar Thermal technologies capture the heat energy from the sun and use it for heating and/or the production of electricity. Learn more about solar thermal and all types of energy at www.studentenergy.org -------- Student Energy is currently developing the Global Youth Energy Outlook, a global youth-led report that will engage 50,000 young people around the world in 2021 to gather their perspectives on energy. Want to take part? If you’re between 18-30, head to www.bit.ly/gyeo to complete the survey! You can win $100 cash prizes in each region, or a fully funded trip to the next International Student Energy Summit! Student Energy is a global youth-led organization empowering the next generation of leaders who are accelerating the transition to a sustainable, equitable energy future. We work with a network of 50,000 young people from over 120 countries to build the knowledge, skills, and networks they need to take action on energy. Learn more at www.studentenergy.org
Play Video
Play Video
01:01
Solar 101
Solar energy refers to technologies that convert the sun's heat or light to another form of energy for use. Learn more about solar energy and all types of energy at www.studentenergy.org -------- Student Energy is currently developing the Global Youth Energy Outlook, a global youth-led report that will engage 50,000 young people around the world in 2021 to gather their perspectives on energy. Want to take part? If you’re between 18-30, head to www.bit.ly/gyeo to complete the survey! You can win $100 cash prizes in each region, or a fully funded trip to the next International Student Energy Summit! Student Energy is a global youth-led organization empowering the next generation of leaders who are accelerating the transition to a sustainable, equitable energy future. We work with a network of 50,000 young people from over 120 countries to build the knowledge, skills, and networks they need to take action on energy. Learn more at www.studentenergy.org
Play Video
Play Video
04:59
How do solar panels work? - Richard Komp
View full lesson: https://ed.ted.com/lessons/how-do-solar-panels-work-richard-komp The Earth intercepts a lot of solar power: 173,000 terawatts. That’s 10,000 times more power than the planet’s population uses. So is it possible that one day the world could be completely reliant on solar energy? Richard Komp examines how solar panels convert solar energy to electrical energy. Lesson by Richard Komp, animation by Globizco.
Play Video
Play Video
01:51
Solar Photovoltaics 101
Solar Photovoltaic (PV) technology converts the sun’s energy into direct current electricity by using semiconductors. Learn more about Solar PV and all types of energy at www.studentenergy.org -------- Student Energy is currently developing the Global Youth Energy Outlook, a global youth-led report that will engage 50,000 young people around the world in 2021 to gather their perspectives on energy. Want to take part? If you’re between 18-30, head to www.bit.ly/gyeo to complete the survey! You can win $100 cash prizes in each region, or a fully funded trip to the next International Student Energy Summit! Student Energy is a global youth-led organization empowering the next generation of leaders who are accelerating the transition to a sustainable, equitable energy future. We work with a network of 50,000 young people from over 120 countries to build the knowledge, skills, and networks they need to take action on energy. Learn more at www.studentenergy.org
SOLAR SOLUTIONS
Play Video
Play Video
14:29
The Thrilling Potential for Off-Grid Solar Energy | Amar Inamdar | TED
There's an energy revolution happening in villages and towns across Africa -- off-grid solar energy is becoming a viable alternative to traditional electricity systems. In a bold talk about a true leapfrog moment, Amar Inamdar introduces us to proud owners of off-grid solar kits -- and explains how this technology has the opportunity to meet two extraordinary goals: energy access for all and a low-carbon future. "Every household a proud producer as well as consumer of energy," Inamdar says. "That's the democracy of energy." (Followed by a brief Q&A with TED Curator Chris Anderson) Check out more TED Talks: http://www.ted.com The TED Talks channel features the best talks and performances from the TED Conference, where the world's leading thinkers and doers give the talk of their lives in 18 minutes (or less). Look for talks on Technology, Entertainment and Design -- plus science, business, global issues, the arts and more. Follow TED on Twitter: http://www.twitter.com/TEDTalks Like TED on Facebook: https://www.facebook.com/TED Subscribe to our channel: https://www.youtube.com/TED
Play Video
Play Video
03:58
The 'duck curve' is solar energy's greatest challenge
Renewables require change in the energy supply chain. Subscribe to our channel! http://goo.gl/0bsAjO Electricity is incredibly difficult to store, so grid operators have to generate it at the exact moment it is demanded. In order to do this, they create incredibly accurate models of the total electric loads, that is how much energy will be consumed on a given day. But as utilities started to produce more energy from renewable sources like solar, the models started to shift as well. California researchers discovered a peculiarity in their state’s electric load curves, that started to look more and more like a duck. And that duck shaped chart highlights the greatest challenge to solar energy growth in the US. Vox writer David Roberts has been covering the issue for a few years now. You can read some of his past explainers on the duck curve, and its solutions at the links below: https://www.vox.com/energy-and-environment/2018/3/20/17128478/solar-duck-curve-nrel-researcher https://www.vox.com/2016/2/10/10960848/solar-energy-duck-curve https://www.vox.com/2016/4/8/11376196/california-grid-expansion https://www.vox.com/2016/2/12/10970858/flattening-duck-curve-renewable-energy And if you would like to read some of the source material used in the video above, you can check those out here: https://www.caiso.com/documents/flexibleresourceshelprenewables_fastfacts.pdf https://www.nrel.gov/docs/fy16osti/65023.pdf Vox.com is a news website that helps you cut through the noise and understand what's really driving the events in the headlines. Check out http://www.vox.com. Watch our full video catalog: http://goo.gl/IZONyE Follow Vox on Facebook: http://goo.gl/U2g06o Or Twitter: http://goo.gl/XFrZ5H
Play Video
Play Video
04:43
Why aren't we only using solar power? - Alexandros George Charalambides
View full lesson: http://ed.ted.com/lessons/why-aren-t-we-only-using-solar-power-alexandros-george-charalambides Solar power is cheaper and more sustainable than our current coal-fueled power plants, so why haven't we made the switch? The real culprits here are the clouds, which make solar power difficult to control. Alexandros George Charalambides explains how solar towers and panels create electricity and how scientists are trying to create a system that can function even under cloud cover. Lesson by Alexandros George Charalambides, animation by Ace & Son Moving Picture Co., LLC.
Play Video
Play Video
02:48
Solar Thermal 101
Solar Thermal technologies capture the heat energy from the sun and use it for heating and/or the production of electricity. Learn more about solar thermal and all types of energy at www.studentenergy.org -------- Student Energy is currently developing the Global Youth Energy Outlook, a global youth-led report that will engage 50,000 young people around the world in 2021 to gather their perspectives on energy. Want to take part? If you’re between 18-30, head to www.bit.ly/gyeo to complete the survey! You can win $100 cash prizes in each region, or a fully funded trip to the next International Student Energy Summit! Student Energy is a global youth-led organization empowering the next generation of leaders who are accelerating the transition to a sustainable, equitable energy future. We work with a network of 50,000 young people from over 120 countries to build the knowledge, skills, and networks they need to take action on energy. Learn more at www.studentenergy.org
Play Video
Play Video
01:01
Solar 101
Solar energy refers to technologies that convert the sun's heat or light to another form of energy for use. Learn more about solar energy and all types of energy at www.studentenergy.org -------- Student Energy is currently developing the Global Youth Energy Outlook, a global youth-led report that will engage 50,000 young people around the world in 2021 to gather their perspectives on energy. Want to take part? If you’re between 18-30, head to www.bit.ly/gyeo to complete the survey! You can win $100 cash prizes in each region, or a fully funded trip to the next International Student Energy Summit! Student Energy is a global youth-led organization empowering the next generation of leaders who are accelerating the transition to a sustainable, equitable energy future. We work with a network of 50,000 young people from over 120 countries to build the knowledge, skills, and networks they need to take action on energy. Learn more at www.studentenergy.org
Play Video
Play Video
04:59
How do solar panels work? - Richard Komp
View full lesson: https://ed.ted.com/lessons/how-do-solar-panels-work-richard-komp The Earth intercepts a lot of solar power: 173,000 terawatts. That’s 10,000 times more power than the planet’s population uses. So is it possible that one day the world could be completely reliant on solar energy? Richard Komp examines how solar panels convert solar energy to electrical energy. Lesson by Richard Komp, animation by Globizco.
Play Video
Play Video
01:51
Solar Photovoltaics 101
Solar Photovoltaic (PV) technology converts the sun’s energy into direct current electricity by using semiconductors. Learn more about Solar PV and all types of energy at www.studentenergy.org -------- Student Energy is currently developing the Global Youth Energy Outlook, a global youth-led report that will engage 50,000 young people around the world in 2021 to gather their perspectives on energy. Want to take part? If you’re between 18-30, head to www.bit.ly/gyeo to complete the survey! You can win $100 cash prizes in each region, or a fully funded trip to the next International Student Energy Summit! Student Energy is a global youth-led organization empowering the next generation of leaders who are accelerating the transition to a sustainable, equitable energy future. We work with a network of 50,000 young people from over 120 countries to build the knowledge, skills, and networks they need to take action on energy. Learn more at www.studentenergy.org
GENSETS
Play Video
Play Video
01:25
Addressing mobile operators' concerns over Diesel Exhaust Fluid
A new video from Cummins addresses how its mobile generators are fully compliant with Tier 4 Final standards and reliably provide onsite power without the DEF handling headaches. Learn more at: http://rental.tier4answers.com
Play Video
Play Video
01:57
Cummins- The Power of One
What is the Power of One? it’s the unique set of advantages that you get when you purchase a genset that is designed and manufactured by Cummins. It’s one company with 100 years of knowledge and expertise. It’s one source for pre-integrated systems. It’s access to one extensive global network for sales and support. It’s one brand that stands for dependability. It's all of this and more. It's what we call The Power of One. Learn more at https://power.cummins.com/.
Play Video
Play Video
01:11
Upgraded Cummins QSK60 Gas Series Generator Sets
Cummins has released the new 50Hz gas generator set offering an increase in efficiency and power output. For more information, visit us online at http://power.cummins.com/.
WIND POWER
Play Video
Play Video
05:29
How do Wind Turbines work?
Working of a wind turbine is illustrated in this video with the help of animation. The topic covered are blade design, use of brake, velocity sensor, yawing mechanism, blade tilting, wind turbine efficiency and Betz's limit. • Learn more about JAES: https://jaescompany.com/index.php?lang=en • Learn more about our projects: https://jaescompany.com/elearning.php?lang=en • Here are some products installed by Jaes: https://jaescompany.com/catalogo_marche.php?lang=en
Play Video
Play Video
01:47
Wind Power 101
Wind Energy refers to technology that converts the air’s motion into mechanical energy usually for electricity production. Learn more about wind power and all types of energy at www.studentenergy.org -------- Student Energy is currently developing the Global Youth Energy Outlook, a global youth-led report that will engage 50,000 young people around the world in 2021 to gather their perspectives on energy. Want to take part? If you’re between 18-30, head to www.bit.ly/gyeo to complete the survey! You can win $100 cash prizes in each region, or a fully funded trip to the next International Student Energy Summit! Student Energy is a global youth-led organization empowering the next generation of leaders who are accelerating the transition to a sustainable, equitable energy future. We work with a network of 50,000 young people from over 120 countries to build the knowledge, skills, and networks they need to take action on energy. Learn more at www.studentenergy.org
Play Video
Play Video
Future.Legacy. - Vestas 4 MW Platform
Future.Legacy - futurelegacy.vestas.com For the future of wind energy, Vestas 4 MW platform builds on a legacy of proven and tested technology. Connect with us on the following social channels: Facebook: https://www.facebook.com/vestas Twitter: https://twitter.com/vestas LinkedIn: http://www.linkedin.com/company/vestas Instagram: https://instagram.com/vestas/
Play Video
Play Video
02:07
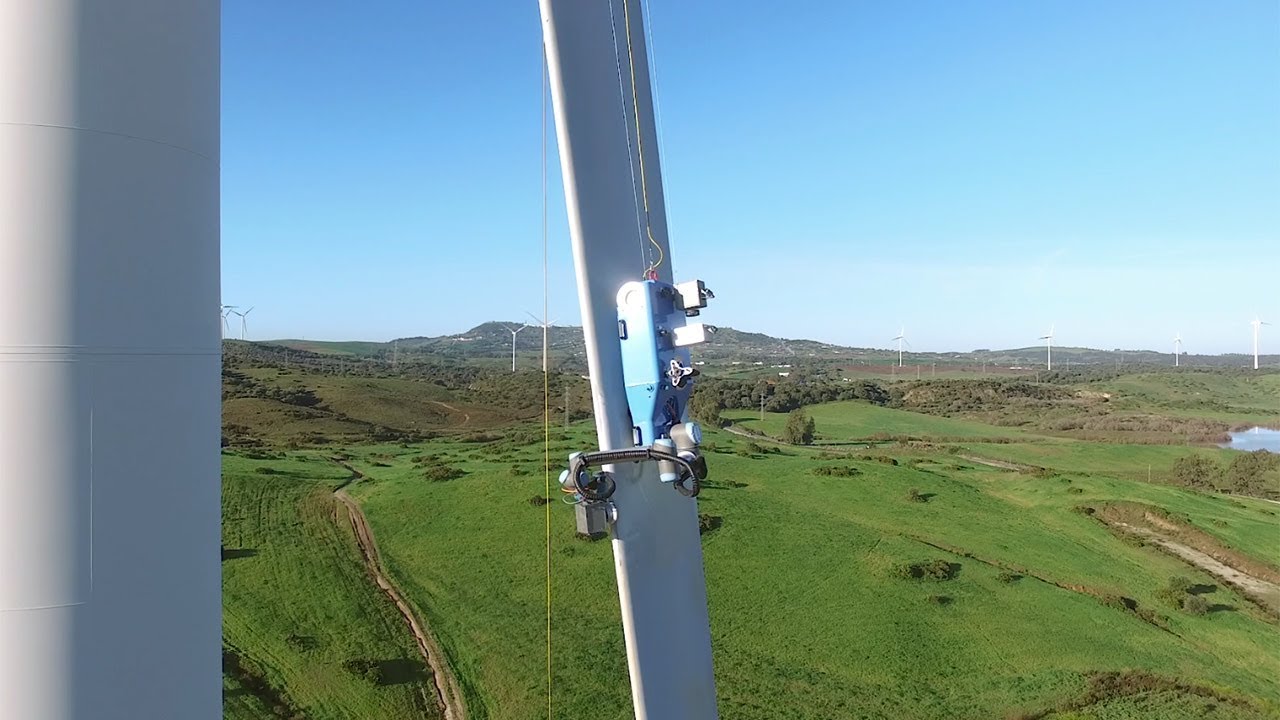
How a small robot innovates rotor blade inspection
The traditional maintenance and repair of wind turbine blades can be complex and costly, taking place at dizzying heights or at sea. We believe there is a better way. Hanging on two ropes, it navigates along the blades with precision cameras and sensors, uses an arm for minor repairs and carries a variety of tools on its back: a small robot for blade repairs. See how it works.
Play Video
Play Video
02:22
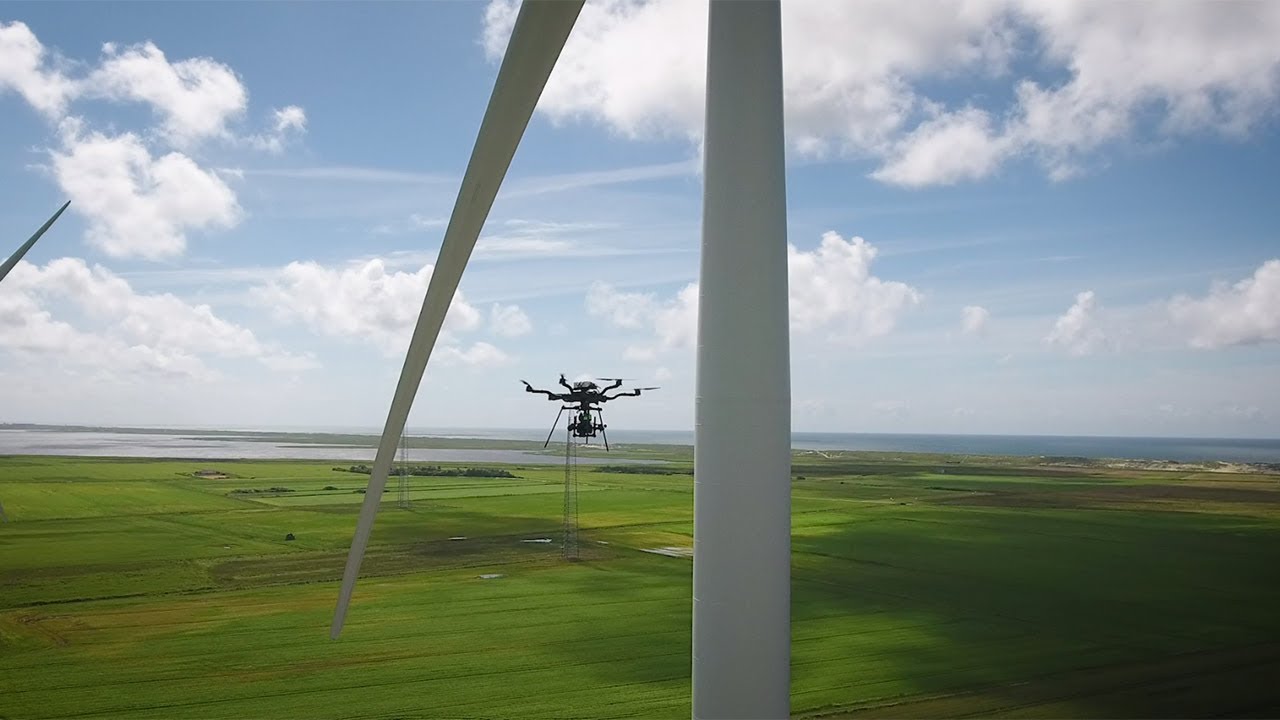
How autonomous drones take care of rotor blades
The tip speed of wind turbine rotor blades can reach more than 300 km/h. Imagine a rain drop hitting the leading edge. The impact is compareable to a bullet. Together with Skyspecs, we have introduced autonomous drones to detect such damage. The drone flies without a human operator using advanced sensors. It is therefore faster, more efficient and less expensive than conventional methods. See how it works. https://www.siemensgamesa.com
Play Video
Play Video
01:33
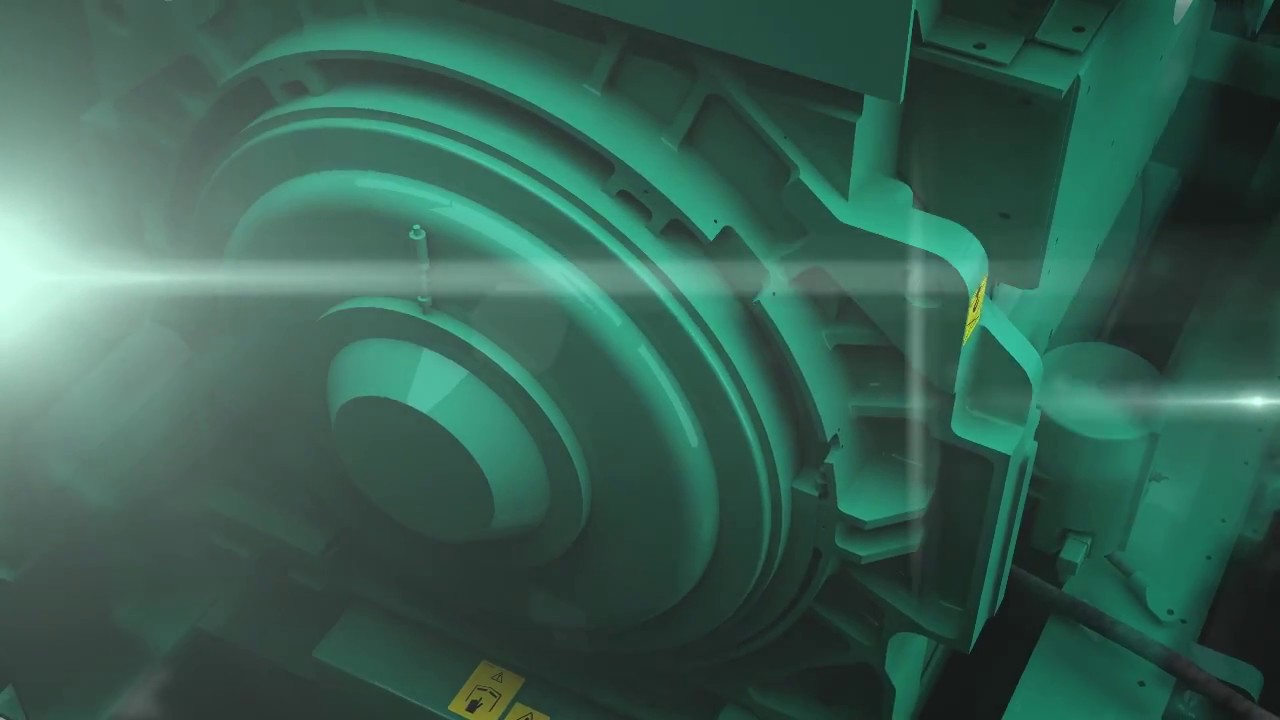
Optimised Drive Train
Optimised design and technology allows the gearbox to tolerate greater loads.
Play Video
Play Video
03:07
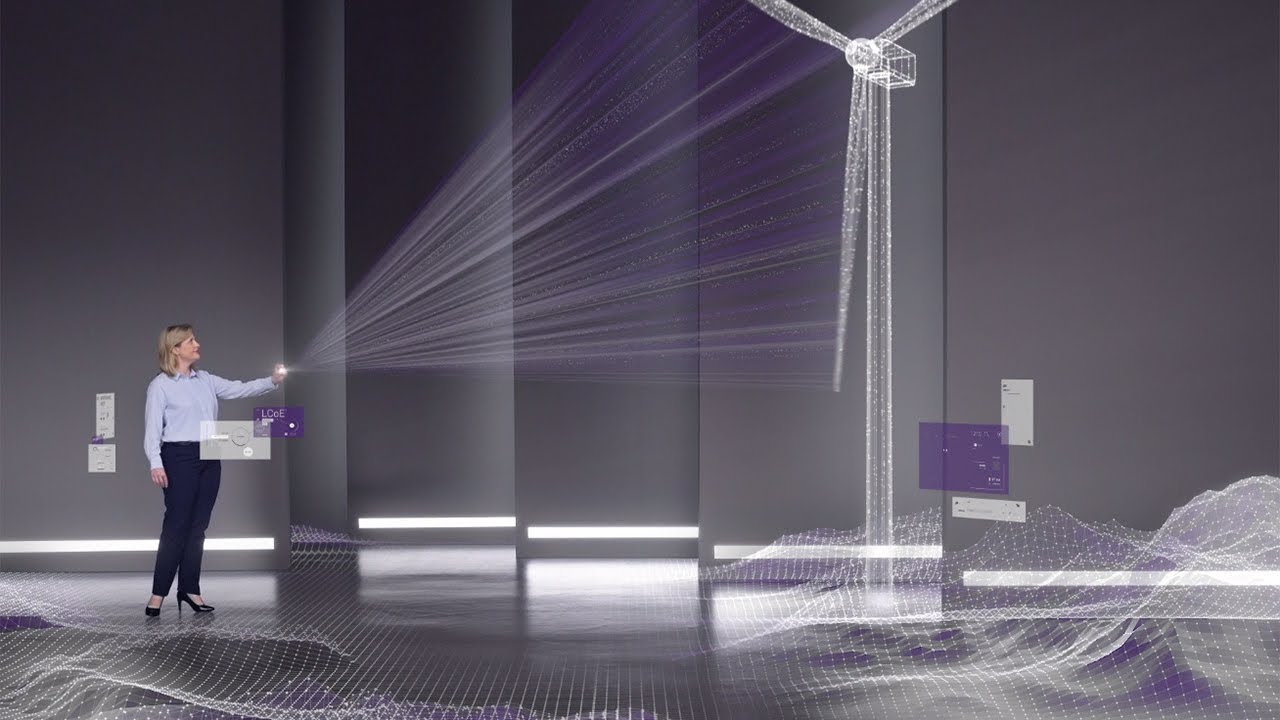
Things go wrong when things don't turn: big data powering wind energy
The future of the wind industry will not be business as usual. How are big data insights powering a new era of smart wind power and transforming the entire digital enterprise, accelerating innovation, and harnessing new opportunities? Take a tour with our Cassia Pole. https://www.siemensgamesa.com/en-int/explore/innovations/digitalization
Play Video
Play Video
02:18
Vestas Anti-Icing System™
Discover Vestas' Anti-Icing System™ Vestas Anti-Icing System™ efficiently removes ice formation on wind turbine blades during operation to maximize energy production. As part of Vestas’ portfolio of cold climate solutions, it helps address performance challenges associated with operation in cold climate conditions.
Nuclear Power
Play Video
Play Video
13:47
We need nuclear power to solve climate change | Joe Lassiter
Joe Lassiter is a deep thinker and straight talker focused on developing clean, secure and carbon-neutral supplies of reliable, low-cost energy. His analysis of the world's energy realities puts a powerful lens on the stubbornly touchy issue of nuclear power, including new designs for plants that can compete economically with fossil fuels. We have the potential to make nuclear safer and cheaper than it's been in the past, Lassiter says. Now we have to make the choice to pursue it. TEDTalks is a daily video podcast of the best talks and performances from the TED Conference, where the world's leading thinkers and doers give the talk of their lives in 18 minutes (or less). Look for talks on Technology, Entertainment and Design -- plus science, business, global issues, the arts and much more. Find closed captions and translated subtitles in many languages at http://www.ted.com/translate Follow TED news on Twitter: http://www.twitter.com/tednews Like TED on Facebook: https://www.facebook.com/TED Subscribe to our channel: http://www.youtube.com/user/TEDtalksDirector
Play Video
Play Video
04:49
What Is Nuclear Energy? With Tom Scott | Earth Science
Greg Foot is joined by explorer and explainer extraordinaire Tom Scott at Kelvedon Hatch to demonstrate nuclear energy! Subscribe for more fascinating science: http://bit.ly/SubscribeToEarthLab Watch Part Two: https://youtu.be/-GGx6bBJv2U Watch Tom Scott's video all about Britain's end-of-the-world-bunkers: https://www.youtube.com/watch?v=BTPToO-gfTE Footnote 1 - http://www.bbc.co.uk/schools/gcsebitesize/science/add_aqa_pre_2011/radiation/nuclearfissionrev2.shtml Footnote 2 - http://www.nytimes.com/1999/02/27/us/glenn-seaborg-leader-of-team-that-found-plutonium-dies-at-86.html Welcome to BBC Earth Science! Here we answer all your curious questions about science in the world around you (and further afield too). If there’s a question you have that we haven’t yet answered let us know in the comments on any of our videos and it could be answered by one of our Earth Science experts.
Play Video
Play Video
09:29
This Teenager Will Revolutionize Nuclear Power | Archives | NBC News
At age 11, Taylor Wilson told his parents that he wanted to build a nuclear reactor in the family garage. His parents never guessed he would do it, but three years later Taylor made history. » Subscribe to NBC News: http://nbcnews.to/SubscribeToNBC » Watch more Archives: http://bit.ly/NBCArchives Since then Taylor has continued to amaze everyone around him with inventions like a cheaper way to make medical isotopes to treat cancer, and a better way to detect dirty bombs. Rock Center's Harry Smith hikes in the mountains of Western Nevada with this boy wonder to learn what makes Taylor Wilson tick. About: NBC News is a leading source of global news and information. Here you will find clips from NBC Nightly News, Meet The Press, and our original series Debunker, Flashback, Nerdwatch, and Show Me. Subscribe to our channel for news stories, technology, politics, health, entertainment, science, business, and exclusive NBC investigations. Connect with NBC News Online! Visit NBCNews.Com: http://nbcnews.to/ReadNBC Find NBC News on Facebook: http://nbcnews.to/LikeNBC Follow NBC News on Twitter: http://nbcnews.to/FollowNBC Follow NBC News on Google+: http://nbcnews.to/PlusNBC Follow NBC News on Instagram: http://nbcnews.to/InstaNBC Follow NBC News on Pinterest: http://nbcnews.to/PinNBC This Teenager Will Revolutionize Nuclear Power | Archives | NBC News
Play Video
Play Video
16:29
The Future of Energy | Taylor Wilson | TEDxUniversityofNevada
Veteran TED speaker Taylor Wilson shares his thoughts on the future of energy. Taylor Wilson was born in Arkansas in 1994. In 2009 at age 14, Taylor became the youngest person in history to produce nuclear fusion, and went on to develop many novel nuclear technologies including security, medical, and energy innovations, afterwards founding companies to commercialize these inventions. In addition to running his commercial endeavors, Taylor directs several academic laboratories for fundamental and applied research in nuclear science. Along with his commercial and scientific interests, Taylor studies the history of science and technology and works to inspire a new generation of scientists and engineers to dream big and use technology to make the world a better place. This talk was given at a TEDx event using the TED conference format but independently organized by a local community. Learn more at http://ted.com/tedx
Play Video
Play Video
13:59
How fear of nuclear power is hurting the environment | Michael Shellenberger
"We're not in a clean energy revolution; we're in a clean energy crisis," says climate policy expert Michael Shellenberger. His surprising solution: nuclear. In this passionate talk, he explains why it's time to overcome longstanding fears of the technology, and why he and other environmentalists believe it's past time to embrace nuclear as a viable and desirable source of clean power. TEDTalks is a daily video podcast of the best talks and performances from the TED Conference, where the world's leading thinkers and doers give the talk of their lives in 18 minutes (or less). Look for talks on Technology, Entertainment and Design -- plus science, business, global issues, the arts and much more. Find closed captions and translated subtitles in many languages at http://www.ted.com/translate Follow TED news on Twitter: http://www.twitter.com/tednews Like TED on Facebook: https://www.facebook.com/TED Subscribe to our channel: http://www.youtube.com/user/TEDtalksDirector
Play Video
Play Video
12:54
Taylor Wilson: My radical plan for small nuclear fission reactors
Taylor Wilson was 14 when he built a nuclear fusion reactor in his parents' garage. Now 19, he returns to the TED stage to present a new take on an old topic: fission. Wilson, who has won backing to create a company to realize his vision, explains why he's so excited about his innovative design for small modular fission reactors -- and why it could be the next big step in solving the global energy crisis. TEDTalks is a daily video podcast of the best talks and performances from the TED Conference, where the world's leading thinkers and doers give the talk of their lives in 18 minutes (or less). Look for talks on Technology, Entertainment and Design -- plus science, business, global issues, the arts and much more. Find closed captions and translated subtitles in many languages at http://www.ted.com/translate Follow TED news on Twitter: http://www.twitter.com/tednews Like TED on Facebook: https://www.facebook.com/TED Subscribe to our channel: http://www.youtube.com/user/TEDtalksDirector
Play Video
Play Video
06:01
5 Things You Wouldn't Expect a Nuclear Reactor To Do
Did you know that a nuclear reactor isn't the same thing as a nuclear power plant? What a nuclear reactor can do might surprise you. ---------- Other reactor footage from: Czech Technical University in Prague (https://www.youtube.com/watch?v=-VOpdolSRqg) Los Alamos National Lab (https://www.youtube.com/watch?v=w4QhJEX6DiQ) Reactor fuel image from Neutron Radiography of Irradiated Nuclear Fuel at Idaho National Laboratory (https://www.sciencedirect.com/science/article/pii/S1875389215006781) Elevator Music Two Point Oh by JackBillPlatypus (https://soundcloud.com/jackbillplatypus/elevator-music-two-point-oh) ---------- Find us online! MIT Nuclear Reactor: https://nrl.mit.edu/ Facebook: http://www.facebook.com/MITK12 Twitter: http://www.twitter.com/MITK12Videos http://k12videos.mit.edu ---------- made with love at MIT Creative Commons: CC BY-NC-SA, MIT http://k12videos.mit.edu/terms-and-conditions
Play Video
Play Video
20:29
Why I changed my mind about nuclear power | Michael Shellenberger | TEDxBerlin
For more information on Michael Shellenberger, please visit www.tedxberlin.de. Michael Shellenberger is co-founder and Senior Fellow at the Breakthrough Institute, where he was president from 2003 to 2015, and a co-author of the Ecomodernist Manifesto. Over the last decade, Michael and his colleagues have constructed a new paradigm that views prosperity, cheap energy and nuclear power as the keys to environmental progress. A book he co-wrote (with Ted Nordhaus) in 2007, Break Through: From the Death of Environmentalism to the Politics of Possibility, was called by Wired magazine “the best thing to happen to environmentalism since Rachel Carson’s Silent Spring,” while Time Magazine called him a “hero of the environment.” In the 1990s, he helped protect the last signi cant groves of old-growth redwoods still in private hands and bring about labor improvements to Nike factories in Asia. This talk was given at a TEDx event using the TED conference format but independently organized by a local community. Learn more at https://www.ted.com/tedx
bottom of page